The four numbers worth your attention
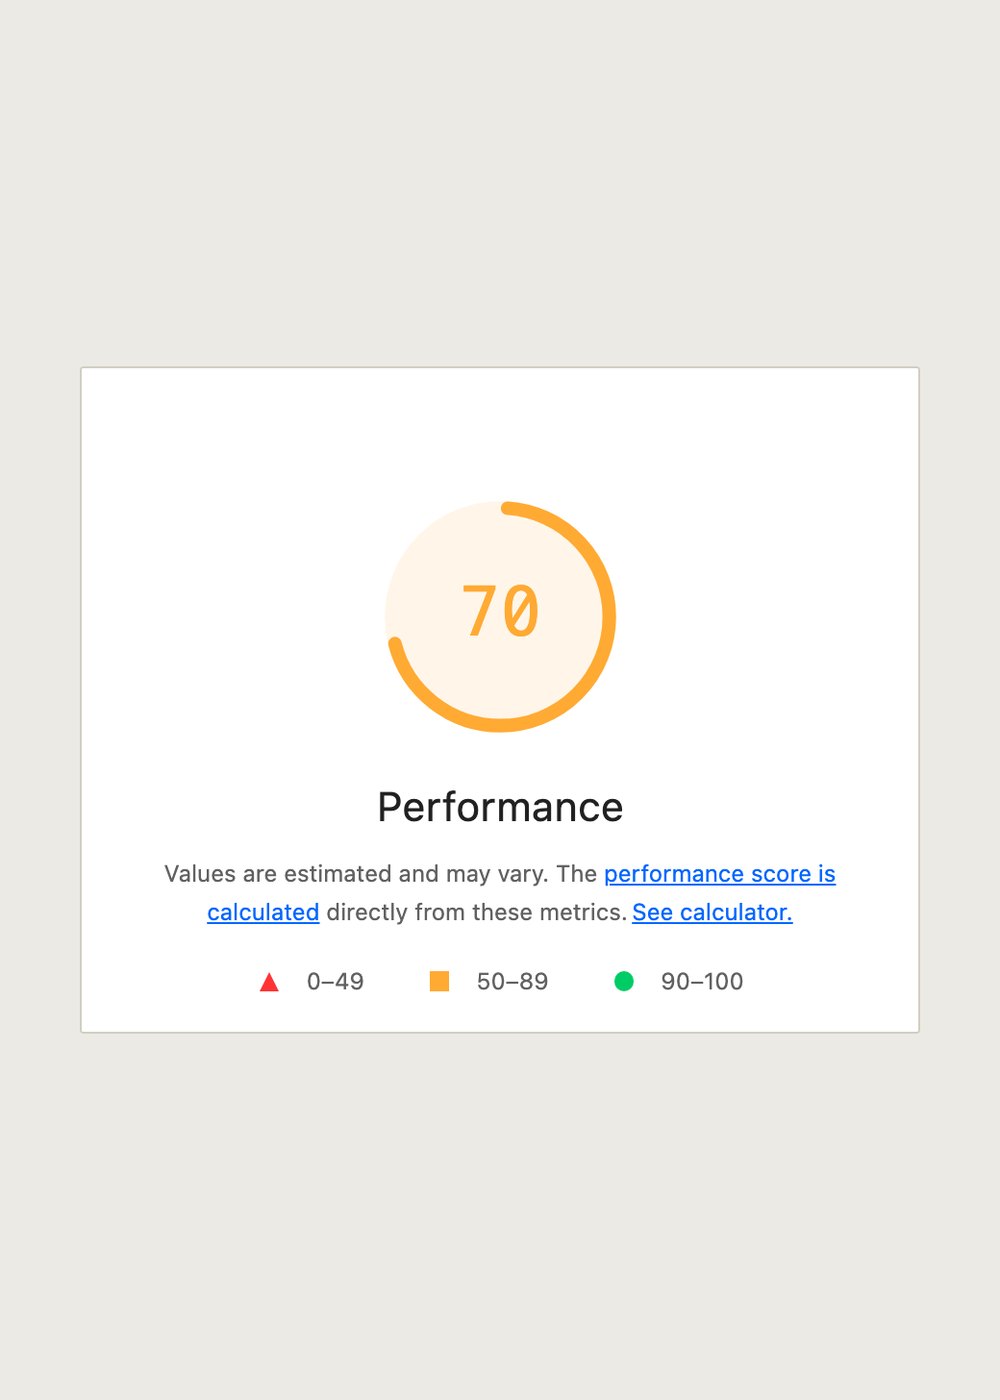
A Lighthouse performance report hands you a score out of 100 and the metrics behind it. The score is a weighted average, so it moves for reasons a shopper would never feel. Read the metrics instead. Largest Contentful Paint says when the main thing appeared. Cumulative Layout Shift says how much the page jumped while loading. Total Blocking Time says how long the main thread was too busy to answer a tap. Server response time says how long Shopify took to start replying.
Interaction to Next Paint is the metric Google now uses for responsiveness, and Lighthouse cannot measure it in a lab run because nobody interacts with the page. If you want it, you need field data: the Web Performance report in your Shopify admin, or the Core Web Vitals section of Google Search Console.
What you can safely ignore
The Opportunities list is ordered by estimated saving, not by whether you can act on it, and several entries on a Shopify store are structural. Your theme decides how images are served. Shopify decides which of its own scripts load and when. Diagnostics such as avoiding an enormous network payload are useful reading, but they are not a task list you owe anybody.
On a first pass, ignore anything you cannot change without a developer. The three things a merchant can usually fix alone are an oversized hero image, a slider or an autoplaying video above the fold, and an app block placed higher in the template than the feature needs to be.
Make the test repeatable
A lab result only means something next to another lab result taken the same way. Open Chrome in an incognito window with extensions disabled, open DevTools, choose the Lighthouse panel, pick the Mobile preset, and run the same URL three times. Take the median of the three rather than the best of the three, because the best run is the one that flatters you.
PageSpeed Insights runs the same engine on Google hardware and, once your store has enough traffic, shows real user field data above the lab section. When the two disagree, believe the field data. It is measuring your customers, on their phones, on their networks, which is the only audience that pays you.
Test three templates, not one. Home, a product page, and a collection page fail in different ways, and the home page is usually the least representative of where the money is made.
Turning a report into a decision
Set one baseline per quarter and keep it where you will find it again: date, theme name and version, the three URLs, the median for each metric, and the apps that were live. A number with no baseline cannot tell you whether last month made anything worse, which is the only question a report is good at answering.
If a score drops and the report does not explain why, stop reading the report and start eliminating. Duplicate the theme, hide one thing, run three times, restore it, move to the next thing. It is slower to describe than it is to do, and it produces an answer rather than a theory.